Particulate pollution from residential wood burning
03 October 2018
The Clean Air Act 1956 created Smoke Control Zones where solid fuel use was heavily restricted, accelerating the almost wholesale move to natural gas as the principal heating fuel in urban areas. In recent times, control of particulate matter emissions has focused on large combustion plant and road traffic. However, while the full implementation of integrated industrial emissions control and the use of particulate traps and other technologies on road vehicles has dramatically reduced these sources, the aesthetics and “green” credentials of wood as a domestic fuel have massively increased its use. Data are still uncertain, but the Clean Air Strategy estimates that 38% of primary emissions of particulate matter now come from solid fuel use in the domestic sector, as opposed to 12% for road transport.
Below, we examine the role of wood burning in driving health effects from air pollution, and the difficulties in estimating just how much of the UK’s particulate matter emissions originate from this source.
Health impacts and residential wood consumption
The smaller fraction of particulate matter (PM2.5), which is often released during fuel combustion processes, is of health concern due to the ability of particles to penetrate deep within the lungs. The Committee on the Medical Effects of Air Pollutants (COMEAP) estimates that PM2.5 is responsible for a shortened lifespan, equivalent to a total loss of 340,000 life-years across the entire UK population. This equates to 29,000 deaths per year[1].
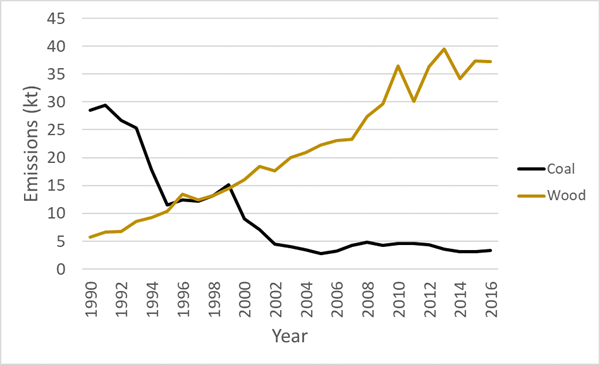
The burning of wood in domestic appliances is a growing concern in the UK, with DECC (now BEIS) conducting a Domestic Wood Survey in 2015[2], finding that the UK has consistently underestimated domestic wood fuel use in the past. The result was an upward revision to wood consumption estimates in the UK energy statistics, which act as key input data to the UK emission inventory. As such, residential wood combustion is now the most significant source of PM2.5 emissions in the UK based on the latest data[3]. Figure 1 highlights the significant swing in the attribution of residential PM2.5 emissions from being largely coal-based to an ever-increasing share from wood combustion since 1990.

Figure 1: Residential PM2.5 emissions in the UK, attributed to coal and wood burning, 1990-2016
Challenges in estimating PM2.5 from wood burning
The potential negative health impacts of particulate matter can be amplified on a localised basis, where urban sources such as residential wood stoves can contribute to high pollution concentrations. This observation matches well to measured PM concentrations across London in evenings during the winter months[4]. As such, developing a greater understanding of the level of wood burning activity in residential appliances is of upmost importance. There are a number of challenges in achieving this goal due to the complexity of particulate matter and the uncertainties of estimating total emissions at the national scale.
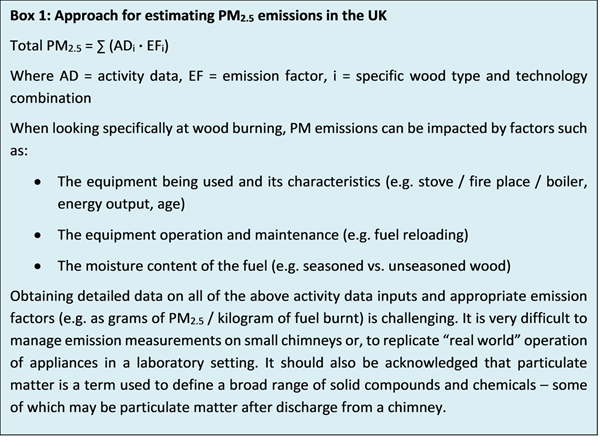
At a simple level, estimates of total PM2.5 emissions are made using the approach outlined in Box 1 below. For wood burning, emissions are dependent upon activity data and the emission factor applied. The complexity of estimating PM is easily highlighted in comparison to the relative simplicity of estimating another primary air pollutant, SO2. For fuel combustion sources, SO2 is estimated on the basis of the fuel sulphur content and the amount of fuel burnt. Both of these aspects are well known. The UK has reliable data on fuel quality and the total consumption of high sulphur fuels (coal and liquid fuels) are also much better quantified than for wood consumption in the UK. The quantity of high sulphur fuels used in domestic heating in the UK is less well known. However, this contributes a very small percentage to overall fuel use. Emissions of PM can be extremely variable due to a range of factors involved in determining the emissions output.
Emissions from residential wood burning are particularly challenging to estimate. This is because the amount of wood used is highly uncertain and emissions of most pollutants are heavily dependent on the way in which the wood is used and the specifics of the appliance. Emissions in recent years have become increasingly complex to estimate because wood is now consumed in a much wider array of different domestic appliances. Wood can be used in a traditional “open fire”, in a simple “wood burner”, or in sophisticated modern equipment. Emission rates vary considerably across the different domestic appliances, depending on how well the conditions of the combustion can be controlled. More sophisticated modern equipment provides more complete combustion, which gives rise to lower emission rates of PM2.5. But in general, the use of wood as a domestic fuel gives rise to relatively high levels of PM2.5 compared to the use of natural gas or oil.

The PM2.5 inventory, recalculations and implications
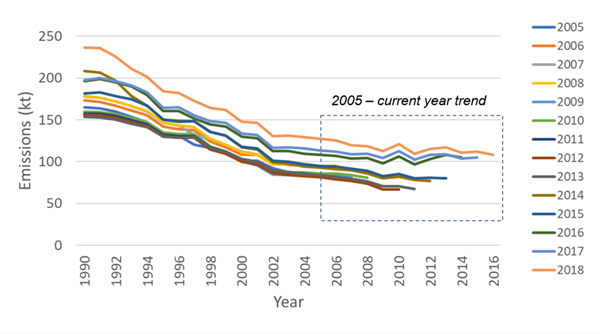
Due to the high uncertainty of PM2.5 emissions from residential wood burning, the emissions inventory and the time series generated is also uncertain. Figure 2 presents the national PM2.5 inventory that has been submitted by the UK under the CLRTAP in each inventory submission from 2005 to 2018 (each line on the graph is a different inventory). Each year has seen recalculations, meaning that some new data has been implemented (e.g. amount of wood consumption) or a better understanding of the source has been developed (e.g. change of emission factor) and overall the estimates have increased with time.
This can be extremely challenging for national policy makers, particularly where recalculations impact on the emissions trend from 2005 onward. This is because the emissions reduction commitments in place for 2020 under the Gothenburg Protocol are calculated on the basis of percentage change from a 2005 baseline. Figure 2 displays how earlier inventory submissions indicated that UK PM2.5 emissions were showing greater progress towards the 2020 target (a 30% reduction in annual emissions compared to 2005). In comparison, the most recent inventory submissions in 2016, 2017 and 2018 include improved understanding of the residential wood combustion activity and has resulted in increased efforts to put in place policies which tackle this form of air pollution to meet the 2020 target.
Figure 2: UK PM2.5 emissions inventory submissions to CLRTAP

PM2.5 uncertainty and recalculations create implications regarding the utility of the PM2.5 inventory for both scientific and policy purposes. Major uncertainties remain in the PM2.5 inventory, meaning that further improvement in understanding and methodology development may lead to recalculations in future years. This is likely to be an ongoing challenge for policy-makers in determining whether the UK is on course to meet its 2020 emissions reduction commitments.
The national inventory is not designed to be able to provide detailed information on smaller-scale emissions and variation in wood burning practices. However, the UK continues to monitor PM2.5 concentrations in urban and rural locations as part of its Automatic Urban and Rural Network[5] (AURN). Such data provide information on compliance with air quality standards but also provide support to policy development models.
Despite the uncertainties, the inventory provides data essential for establishing compliance and to underpin evaluation of the need, and effectiveness of policies to achieve PM2.5 emission reductions.
Work is currently being undertaken to reduce these key uncertainties. Nevertheless, there is sufficient evidence and data on the adverse health impacts caused by PM2.5 and on the broad scale of the problem to create a strong case for further action.
[1] https://www.gov.uk/government/uploads/system/uploads/attachment_data/file/304641/COMEAP_mortality_effects_of_long_term_exposure.pdf
[2] https://www.gov.uk/government/publications/summary-results-of-the-domestic-wood-use-survey
[3] http://naei.beis.gov.uk/data/
[4] Fuller, G. W., Tremper, A. H., Baker, T. D., Yttri, K. E., & Butterfield, D. (2014). Contribution of wood burning to PM10 in London. Atmospheric Environment, 87, 87-94. DOI: 10.1016/j.atmosenv.2013.12.037
[5] https://uk-air.defra.gov.uk/networks/network-info?view=aurn
See all news