+44 1865 259200
Data Visualisation
Why data visualisation?
Data becomes more meaningful when it is graphically represented, and Aether has developed its expertise in data visualisation. Visualisation of large, complex datasets helps decision makers at all levels to make informed, evidence-based decisions. It also makes the data more accessible to a wider range of audiences, increasing engagement from the public and non-technical users. Visualisation can help to identify and communicate key messages, trends and data features as well as providing the user flexibility to explore the data and tailor the outputs to their individual needs.
Article 12 of the Paris Agreements states “Parties shall cooperate in taking measures, as appropriate, to enhance climate change education, training, public awareness, public participation and public access to information, recognizing the importance of these steps with respect to enhancing actions under this Agreement”, highlighting the importance of transparent data sharing for training, public awareness, and participation.
Aether’s expertise
We have expertise across multiple software options including Tableau, PowerBi and Prezi and we have Tableau certified data visualisation experts in house. We believe that data visualisation can enhance outputs and services that we offer in almost every case. Our experts therefore have experience in the many applications of data visualisation, including producing online, interactive data viewers, static infographics for reports, and dashboards that link to data held in our MRV portals.
Aether’s approach
Our approach to data visualisation projects includes the following stages:
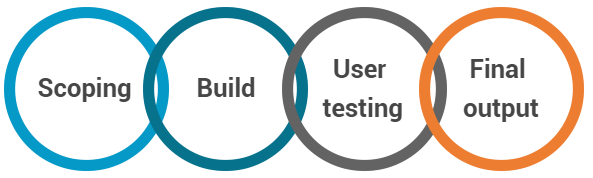
- Scoping: During the scoping phase, we work closely with our customer to identify their needs and the needs of the intended audience. We have discussions around the data that might be shown, how it should be presented and any requirements that the customer may have. At this stage we also discuss which software is most appropriate.
- Build: Using the information gathered during the scoping phase, we produce a draft data visualisation.
- User testing: During the user testing phase, we ask the customer to provide feedback on the draft visualisation. We also conduct internal user testing, conducting in depth checks on the data and functionality of the output, with different types of audiences.
- Final output: Bringing together feedback from the user testing phase, we produce the final output. At this stage it is also possible to work with the customer to translate the visualisation. We will provide the final output along with any required hand over materials such as a user guide, manual for updating, and any background data.
Examples of visualisations that we have produced can be seen below.
For more information, please contact Kathryn Hampshire

Data
Data Visualisation
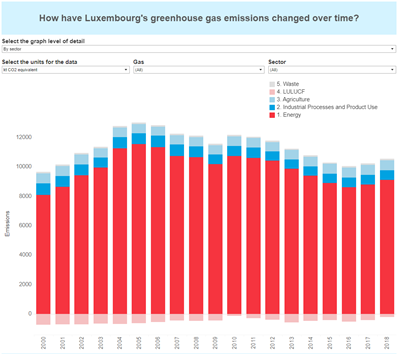
Luxembourg’s Greenhouse Gas and Air Pollutant Data Viewer
Government of Luxembourg
This viewer presents Luxembourg's greenhouse gas and air pollutant emissions in the past, present and future. It also provides information on policies and measures and the potential wider impacts of climate action. This analysis will be updated for the preparation of policies and measures for the updated integrated NECP required in 2023.
View visual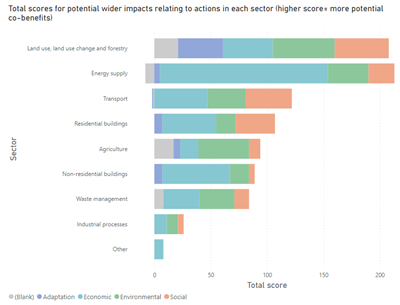
Wider impacts visualisation
Data in our wider impacts database is summarised in these interactive visualisations of climate actions and their co-benefits.
View visualProgress towards local net zero targets
September 2023
Explore progress towards local authority net zero targets. The viewer combines data on targets for net zero across UK local authorities and greenhouse gas emissions data from 2005 to 2021.
View visual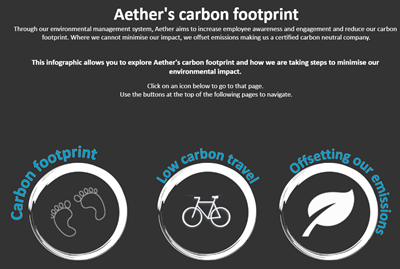
Aether’s Carbon Footprint
January 2025
This infographic visualises Aether's most recent carbon footprint. It shows our company's emissions, broken down by source, and demonstrates how we are trying to minimise our impact through our SME Climate Hub commitment and offsetting our greenhouse gas emissions.
View visual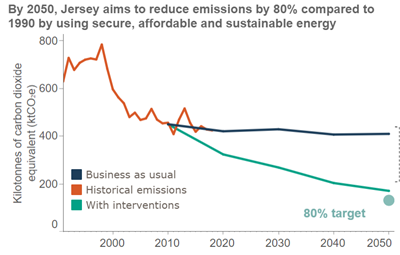
Jersey Infographic
Government of Jersey
August 2021
Aether created a data viewer for the States of Jersey to visualise the Jersey greenhouse gas emissions inventory. The viewer provides insight into the historical emissions in Jersey and allows the user to explore the trends. It also visualises the actions that Jersey have put in place to reduce greenhouse gas emissions, illustrating how Jersey intends to meet the national emissions reduction target.
View visual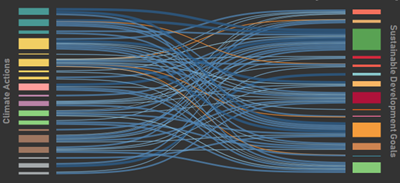
Climate actions and SDGs
An analysis of the wider impacts of climate action can reveal possible synergies and conflicts between climate action and Sustainable Development Goals. This can lead to more effective, joined up policy making where benefits are maximised and areas of caution are highlighted.
View visualCity of London Air Quality
This visualisation allows the user to explore air quality monitoring, trends and possible health impacts in the City of London. In 2001, the whole of the Square Mile was declared an Air Quality Management Area (AQMA) for nitrogen dioxide (NO₂) and small particles (PM₁₀). This was due to levels of these pollutants being higher than the required limits.
View visual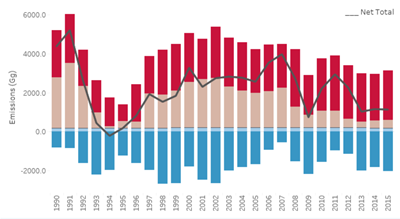
Montenegro Greenhouse Gas Emissions
In 2017, Montenegro ratified the Paris Agreement, committing to reducing greenhouse gas emissions by 30% by 2030 compared to 1990 levels. This data viewer allows you to explore Montenegro's greenhouse gas emissions.
View visual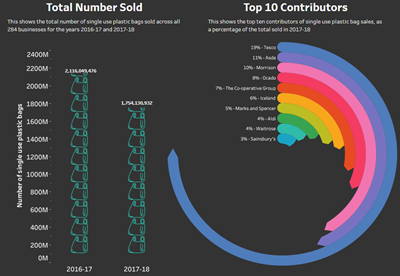
Plastic Bag Charge
Since 5 October 2015, large retailers in England have been required by law to charge 5p for all single use plastic carrier bags. They are required by law to report certain information to Defra, and they provide other information on donations on a voluntary basis. Our visualisation explores the number of plastic bags, the top contributors and the amount generated from the charge that is donated to good causes by retailers.
View visual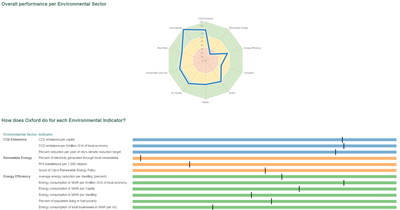
Oxford Sustainability Index
Aether created a data viewer for the Oxford Sustainability Index based on findings from the Oxford Sustainability Index report developed for Oxford City Council in 2016. The viewer visualises Oxford’s sustainability performance along a range of environmental indicators, and allows users to explore the City’s performance compared to other urban areas in England, Scotland and Wales.
View visualParis Tracker
Tracking the ratification progress of the Paris Agreement. In accordance with Article 21, paragraph 1, of the Paris Agreement, the Agreement shall enter into force on the 30th day after the date on which at least 55 Parties to the Convention accounting in total for at least an estimated 55 % of the total global greenhouse gas emissions have deposited their instruments of ratification, acceptance, approval or accession with the Depositary. It entered into force on 4 November 2016.
View visualContact us


